

This article was first published on the Palisadian-Post on July 24, 2026.
The Pali Rebuild Map—found exclusively on the Palisadian-Post website—has been a huge success. I greatly appreciate all the kind words and positive feedback, and I am honored to have been able to serve the community in this way. The data I presented was not new, but it was presented in a new way.
The city makes its own attempt to share rebuild data and I commend them for their attempt at transparency. However, the city seems more concerned with showing us the biggest numbers, rather than helping anyone understand the pace and shape of the rebuild.
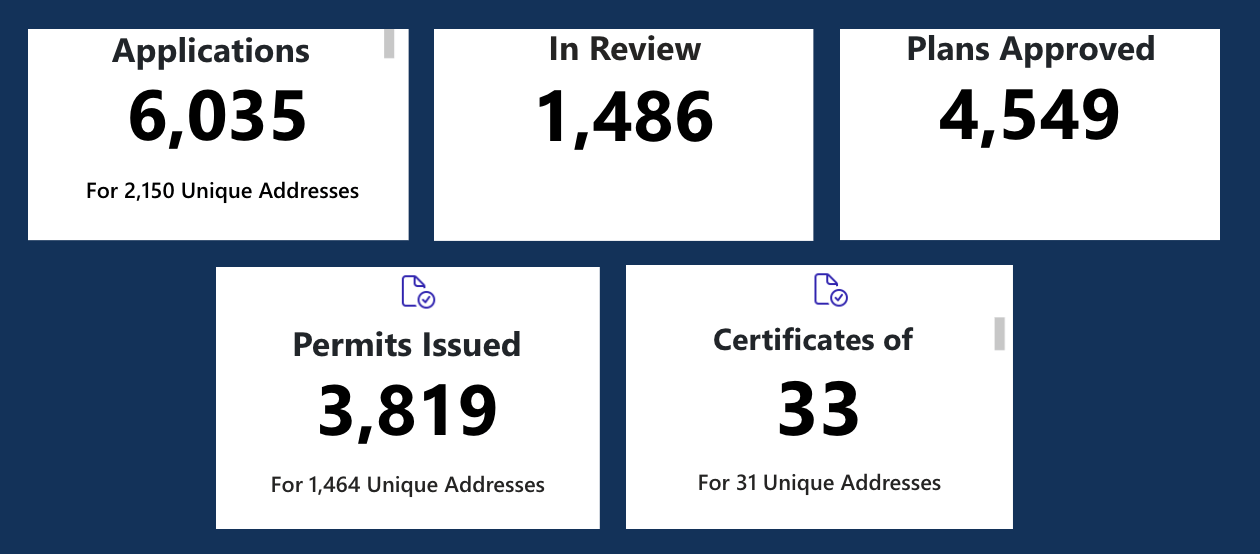
While I think focusing on permit numbers misses the point, I did want to answer the question: Why are the numbers presented on the Pali Rebuild Map so much smaller than what the city presents, even though the map seems to convey more progress?
Simply put: We are only counting one primary permit per parcel. I’ll touch on why later.
This alone cuts the top line number by nearly a third. To build a home in L. A.—as all Palisades residents are now learning—usually requires at least two separate permits, and sometimes four or five.
Here are some approximate permit counts by type that we are not including in our rebuild stats:1
A. Not a building permit — site/ancillary work (2,502)
1,381 Grading
668 Non-building new (retaining walls, etc.)
344 Swimming pool / spa
45 Demolition
44 Non-building alter/repair
18 Sign
2 Other non-building
B. Building work, but not a new primary structure (822)
566 Alter/Repair — supplemental to another permit
172 Addition to an existing building
74 Alter/Repair — ordinary remodel (not fire-related)
8 Alter/Repair — parcel already has a primary rebuild
C. Fire rebuild activity — shown on the map, but out of the top-line (495)
222 ADU new-build (shown as a dot)
142 Fire repair/remodel (dashed border, own tiles)
131 Accessory new-build — garage/patio (dot)
D. Would-be primary — removed by de-dup / damage / void (80)
43 Extra primary permit on an already-counted parcel (de-dup)
28 Primary rebuild, but parcel not materially damaged
So that’s a total of 3,888 permits that are not included in our count—and that still doesn’t quite fill the gap. Some possible explanations:
The city’s public datasets used in this analysis can have quite a bit of lag (1-4 weeks) - Note: the City is sharing data from a source that is not readily available to the public.
Discrepancies in what parcels’ permits are included (minor)
Discrepancies on what permits are counted based on timing and classification. (minor)
There is no structured data to tell us “this is a fire permit,” so we are left to interpret what is fire-related based on timing and description.
The Pali Rebuild Map attempts to close the gap on certain types of permits by automatically reading public permit information directly from LADBS, one address at a time—slowly and responsibly. However, for the purposes of this article, we only used standard city and county datasets.
While we continue to attempt to improve and refine our data so that it is as accurate as possible, dealing with even a relatively small dataset such as this one can present challenges. In the spirit of transparency, I wanted to share a few examples of where accurate measurement and reporting is challenging.
A number of Palisadians have purchased the lot next to theirs and are rebuilding a single home on both. Some are overcoming size limitations by building ADUs. We haven’t yet found a good way to visualize this on the map.
There were a surprising number of projects in progress at the time of the fire that were destroyed. These projects were restarted as legitimate wildfire rebuild projects, but done so as a supplemental permit to the original permit. Accurately detecting these situations is also very difficult.
Despite these limitations, the Pali Rebuild Map still provides a very accurate visual representation of the rebuild progress. In order to track progress, you need to know what you are progressing toward. We do not know how many permits it will take to rebuild the Palisades, but we do know how many parcels need to be rebuilt. And of course, if you are building a map, the unit you want to work with is the parcel.
Zooming in on a single parcel, you can see that progress isn’t binary. There are often dozens of steps as the project moves from permit submission to earning a Certificate of Occupancy over one to two years. By focusing on the primary structure, we can confidently assign a progress value per parcel. Map viewers don’t care when their neighbor’s pool is ready, they want to know when the home is going to be done. By focusing on this subset of the data, our visualization becomes more meaningful.
I think it’s important to share our methodology and be forthcoming about the limitations of any attempt to accurately report this data. But having done so, I want to reassert that the goal of the Pali Rebuild Map is to tell a story.
And that story is: The Palisades is coming back.
Sources
Building and Safety – Building Permits Submitted from 2020 to Present (
gwh9-jnip), LADBS — https://data.lacity.org/resource/gwh9-jnipBuilding and Safety – Building Permits Issued from 2020 to Present (
pi9x-tg5x), LADBS — https://data.lacity.org/resource/pi9x-tg5xCAL FIRE Damage Inspection (DINS), 2025 Palisades Fire — structure damage tiers joined to LA County parcels